emobpy


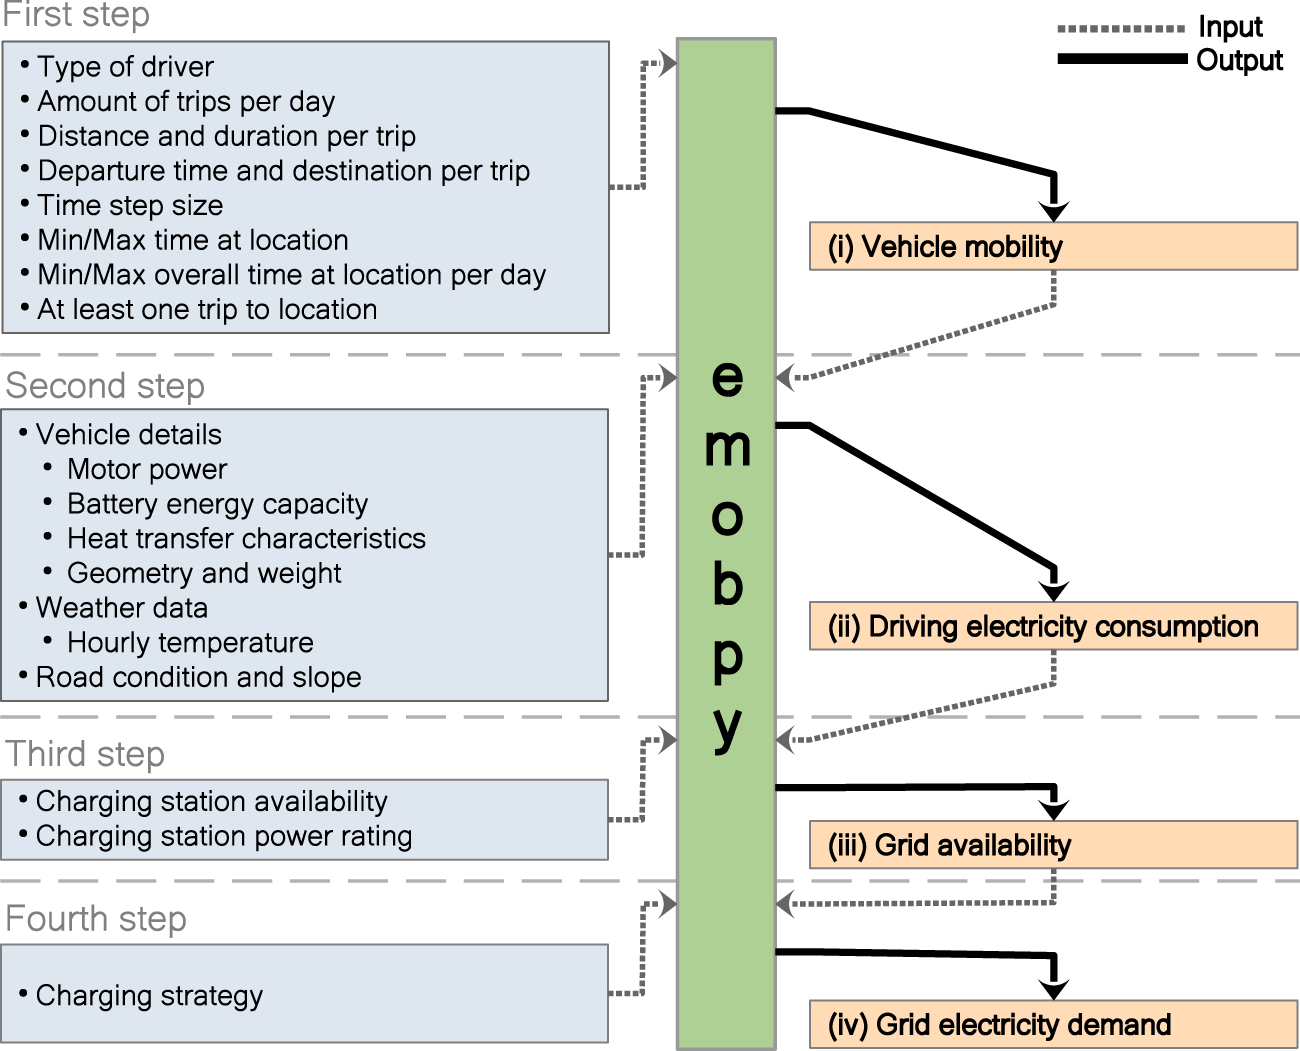
emobpy is a Python tool that can create battery electric vehicle time series. Four different time series can be created: vehicle mobility time series, driving electricity consumption time series, grid availability time series and grid electricity demand time series. The vehicles mobility time series are created based on mobility statistics. For driving electricity consumption time series, the properties of vehicles can be selected from a database with several actual battery electric vehicles models. emobpy is developed by the research group Transformation of the Energy Economy at DIW Berlin (German Institute of Economic Research).
Note
Cite this article: Gaete-Morales, C., Kramer, H., Schill, WP. et al. An open tool for creating battery-electric vehicle time series from empirical data, emobpy. Sci Data 8, 152 (2021). https://doi.org/10.1038/s41597-021-00932-9

Vehicle mobility time series
The vehicle mobility time series contains the location of a vehicle at each point in time. The locations vary according to the mobility of drivers. Possible locations are at home, workplace, shopping, errands, escort, leisure, or driving. When “Driving”, the distance travelled is also provided in the time series. The time resolution can be established initially (our examples contains 15 minutes time steps). The daily number of trips, the departure time, the trip purpose, distance travelled, and duration of the trips are determined based on statistics of mobility surveys. Other considerations can also be set up. For instance, the number of working hours per day, the first and last destination of the day, can be established as “at home”. The “driving” will always be placed in between two different locations.
Driving electricity consumption time series
The previous time series is used as input to the creation of driving electricity consumption time series. The energy required for every trip is calculated based on the ambient temperature and traction effort for the vehicle’s movement. To simulate the travel conditions, driving cycles are taken into account. The tool counts with battery electric vehicle models that are currently in the market. A vehicle’s model has to be selected to include the model’s parameters and characteristics.
Grid availability time series
Grid availability time series consists of taking a driving electricity consumption time series and based on the locations. The model assigns charging stations. Different charging stations can be available for a vehicle, and they are chosen based on a probability distribution that adds up 100% for each location. The charging stations defined in this tool are “home”, “public”, “maker”, “workplace”, “fast” and “none”, although more user-defined charging stations can be established. The charging stations have an associated capacity per time interval, and “none” has zero capacity. Different scenarios of grid availability can be modelled.
Grid electricity demand time series
While a grid availability time series contains at each interval information of the charging stations available, such as the maximum power rating allocated to them, a grid electricity demand time series is the one that indicates the actual consumption of electricity from the grid to charge the battery of a vehicle according to its driving needs and grid availability. There are different options available to create a grid electricity demand time series. For example, “Immediate-Full capacity” is an option that informs the energy drawn from the grid at a maximum power rating of a respective charging station until the battery is fully charged or “Immediate-Balanced” option that creates a time series taking into account the duration of a vehicle is connected to a charging station and the energy required to get the battery fully charged, allowing to charge the battery at a lower capacity than the maximum capacity available.
Instructions
This tool has been tested in window 7, Ubuntu 18.04, Ubuntu 19.04 and Suse Linux. It is recommended to install the package in an dedicated Python environment with Python version 3.6+.
Installation:
pip install emobpy
Usage
You can use our project template. It is a folder that contains files with mobility probabilities, assumptions in a rules file and python scripts that show different python classes and functions to start generating the time series. To get a copy of the template folder, we create a project folder. For instance, as shown below, our project name is my_evs.
emobpy create -n my_evs
Hint
When we create a project folder for the first time, emobpy also copies files to our system user folder. In windows is usually located in c:/users/your_win_user/AppData/Local/emobpy, while for Linux is /home/your_linux_user/.local/share/emobpy. The files hosted contain actual battery electric vehicle models, weather time series hourly across a year for different countries, and driving cycles divided on urban, rural, and highways.
Then by using the command line, we access to project folder my_evs:
cd my_evs
We can run the python script that enables us to generate examples of time series.
python Step1Mobility.py
read the instruction file in my_evs folder
Jupyter notebook offers a more interactive learning. You can open the Time-series_generation.ipynb by running jupyter in your console.
jupyter notebook
In the example section of the documentation, the code is clearly explained. Go directly to the example here.
Remove library:
pip uninstall emobpy
Links
Documentation: https://emobpy.readthedocs.io/
Source code: https://gitlab.com/diw-evu/emobpy/emobpy
PyPI releases: https://pypi.org/project/emobpy
License: http://opensource.org/licenses/MIT
Code DOI: https://doi.org/10.5281/zenodo.3675456
Dataset DOI: https://doi.org/10.5281/zenodo.3931663
Slack chat: https://emobpy.slack.com